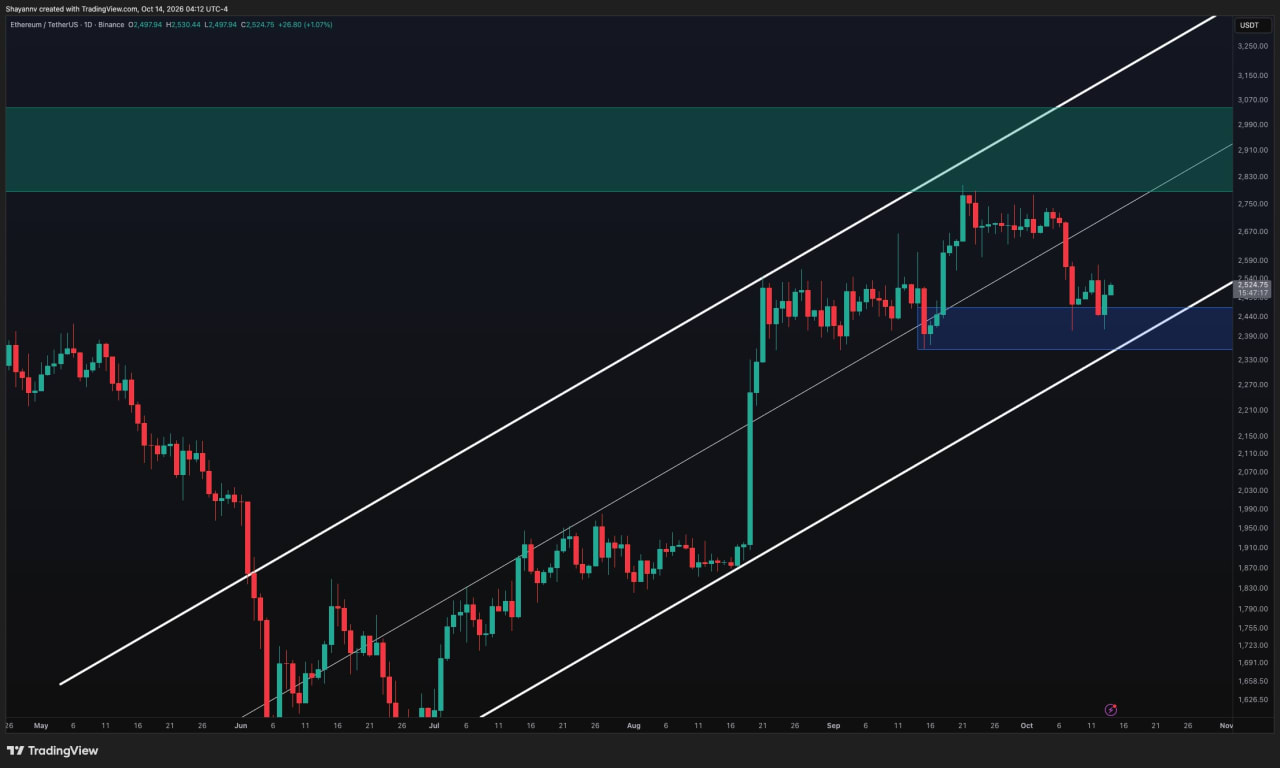

Ethereum is stabilizing around $2.5K after another sharp test of demand near $2.4K. Buyers have defended the recent lows, but the recovery remains below key resistance, leaving the market caught between a potential base and another leg lower.
Ethereum Price Analysis: The Daily Chart
On the daily timeframe, Ethereum remains within its broader ascending channel despite the recent correction. The decline from approximately $2.8K pushed the price below the channel’s midpoint and into the highlighted $2.36K–$2.46K demand zone. Two pronounced lower wicks into this region suggest buyers are responding to selling pressure, though subsequent rebounds have remained relatively modest.
The latest recovery toward $2.52K keeps ETH above demand, but a move through the recent rebound highs around $2.56K–$2.58K is needed to demonstrate improving momentum. Beyond that, the former consolidation around $2.67K–$2.75K represents an important resistance area. Reclaiming it could support another challenge of the broader $2.79K–$3.05K supply zone.
Conversely, renewed weakness would bring the $2.36K–$2.46K demand zone back into focus. This area overlaps with the channel’s rising lower boundary, making it a significant support confluence. A sustained breakdown beneath both would weaken the broader recovery structure and increase the risk of a deeper correction toward $2.3K and $2.2K.
ETH/USDT 4-Hour Chart
The 4-hour chart highlights two sharp declines toward the rising lower trendline around $2.4K–$2.42K, each followed by a rebound. These reactions suggest that buyers are defending the lower portion of the structure, but the latest recovery has yet to clear the previous rebound high near $2.58K.
In the immediate term, ETH is consolidating around $2.5K–$2.53K. A sustained break above this narrow range could bring the $2.56K–$2.58K resistance area into play. Clearing that barrier would strengthen the base-building scenario and open the way toward the marked $2.68K–$2.74K supply zone, where the earlier consolidation broke down.
On the downside, losing $2.48K would expose the upper boundary of demand near $2.46K and potentially trigger another test of the rising trendline around $2.41K. Repeated tests make the response at this support increasingly important. A decisive loss of the trendline and the $2.36K demand boundary would undermine the current stabilization attempt.
Sentiment Analysis
The two-week Binance ETH/USDT liquidation heatmap shows substantial estimated liquidation concentrations above the current price. The nearest prominent overhead band sits around $2.58K–$2.6K, followed by another strong cluster near $2.63K–$2.65K. Additional concentrations remain higher around $2.74K–$2.8K.
The nearby $2.58K–$2.6K cluster aligns with the recent rebound high, making this region relevant to both price structure and leveraged positioning. A sustained advance through it could trigger short liquidations and accelerate the recovery toward the next overhead pool. However, reaching these levels would not itself confirm a lasting bullish reversal.
Below price, estimated liquidation bands remain around $2.47K–$2.49K and the broader $2.37K–$2.4K region. Another loss of nearby support could expose these concentrations and amplify selling through long liquidations. The heatmap therefore highlights potential volatility on both sides, with a break above $2.58K or renewed weakness beneath $2.48K likely to clarify the immediate direction.
The post Ethereum Price Analysis: What’s the Worst-Case Scenario if ETH Loses $2.5K Support? appeared first on CryptoPotato .