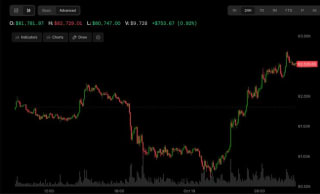

Bitcoin, Ethereum and XRP showed signs of recovery on Monday after a turbulent week marked by persistent US inflation and withdrawals from crypto investment funds.
Bitcoin traded around $82,647 at the time of this report, extending its rebound from the 50-day Exponential Moving Average at $80,607.
Ethereum and XRP were also attempting to stabilize around key support levels following bearish weekly closes.
The recovery faces challenging resistance. Inflation concerns have increased uncertainty about Federal Reserve policy, while ETF redemptions indicate subdued demand through regulated investment products.
For Bitcoin, the immediate test is whether buyers can turn the rebound into a sustained move above nearby resistance.
US inflation keeps interest rate concerns elevated
Last week’s inflation releases reinforced concerns that US price pressures remain difficult to contain.
September’s Consumer Price Index rose 3.7% annually, exceeding market expectations of 3.6%. Producer inflation also surprised to the upside, reaching 6.3% against forecasts of 5.3%.
Together, the readings pointed to elevated price pressures at both the consumer and producer levels, raising concerns about another interest rate increase later this year.
The figures complicated the outlook for cryptocurrencies, which can face pressure when investors anticipate tighter financial conditions and higher borrowing costs.
Although prices are recovering, the rebound does not resolve the macroeconomic uncertainty that contributed to last week’s volatility.
Crypto ETFs saw further withdrawals as investors reduced exposure amid inflation-driven uncertainty.
According to SoSoValue data , Bitcoin ETFs registered $228 million in net outflows last week. That marked the second straight negative week, though withdrawals slowed from $681 million the previous week.
Ethereum ETFs recorded $319 million in outflows, extending their withdrawal streak to three weeks.
XRP funds also turned negative, posting $1.84 million in outflows and ending 13 consecutive weeks of inflows.
The figures indicate that ETF demand remained weak across all three assets. Bitcoin’s smaller weekly outflow suggests withdrawals eased, but a return to sustained inflows would provide stronger evidence of renewed buying appetite.
Bitcoin technical forecast: BTC approaches descending trendline resistance
Bitcoin’s daily chart remains broadly constructive as the price holds above its 50-day EMA at $80,607 and its 200-day EMA at $76,034.
However, the recovery is approaching a descending resistance trendline near $83,823, only slightly above the current price.
A confirmed breakout would strengthen the near-term recovery case and shift attention toward $85,000. That round-number level capped bullish attempts last week and remains an important obstacle.
If buyers sustain a move above $85,000, the next upside reference is the September 21 swing high at $87,395.
Momentum indicators remain mixed. The Moving Average Convergence Divergence indicator is below its signal line, while the Relative Strength Index stands at 51, indicating neutral momentum rather than a decisive bullish shift.
If Bitcoin fails to clear trendline resistance, the 50-day EMA at $80,607 provides the first important support reference.
Holding that level would preserve the latest rebound structure. A sustained break below it would weaken the recovery and draw attention to lower support.
The 200-day EMA at $76,034 remains a deeper level underpinning the medium-term outlook.
For now, Bitcoin is attempting to build on its recovery, but a sustained break above $82,526—and subsequently $85,000—would offer clearer evidence that buyers are regaining control.
The post Why Bitcoin price can’t break $85,000 despite a fresh recovery appeared first on Invezz